
By Adria Cimino – Apr 6, 2026 at 6:15AM EST
Key Points
-
Longtime strategist Jim Paulsen says a look at Walmart stock relative to a particular index can offer valuable insights.
-
The stock market has been in rocky territory in recent weeks.

Image source: Getty Images.
Walmart as a barometer
As you probably know, Walmart sells a broad range of goods, from groceries and essentials to general merchandise, and the company’s focus is on value. So you can count on Walmart for extra-low prices. Lower-income individuals usually feel the pressure of recessions before others and feel it more deeply, Paulsen wrote last week in a Substack post. His theory is that Walmart, which often serves the most cost-conscious consumers, may be a good barometer of the economy.
With this in mind, Paulsen compares Walmart’s stock performance with the S&P Global Luxury Index — outperformance by Walmart could suggest a recession or slowdown is on the horizon. This is because, as these situations build, purchasing tends to be stronger at discounters versus luxury goods companies. Paulson updated the Walmart Recession Signal in his post, showing that it has reached almost its highest level ever — that level was recorded during the financial crisis in 2008.
Paulsen doesn’t forecast a recession this year, but says he’s “becoming more convinced” that a significant slowdown is developing. And this comes at a time when fellow experts also are becoming more cautious about the U.S. economy — for example, Goldman Sachs recently increased its recession probability to 30%.
Expand

SNPINDEX: ^GSPC
S&P 500 Index
Today’s Change
(0.11%) $7.37
Current Price
$6582.69
Key Data Points
Day’s Range
$6474.94 – $6601.91
52wk Range
$4835.04 – $7002.28
Volume
2.7B
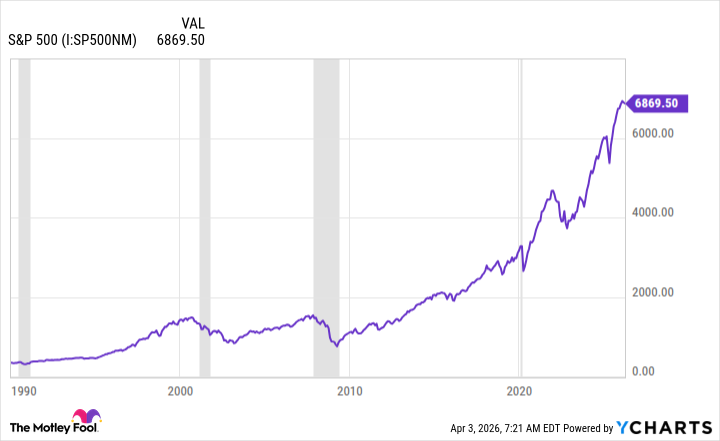
Now, let’s consider what history says this may mean for the stock market. In the chart below, we can see periods of U.S. recessions — the shaded areas — and the dip in the S&P 500 that generally has accompanied those times.
What valuation tells us
So, if the economy enters a recession, history suggests stocks will ly decline. But what if, as Paulsen suggests, the economy simply enters a slowdown? Before answering that question, it’s important to take a look at another metric: the S&P 500 Shiller CAPE ratio. This is an inflation-adjusted measure of stock prices in relation to earnings per . It offers us a clear picture of valuation today, and we can see how it’s evolved over time.
And today, the Shiller CAPE ratio has reached a level it’s only surpassed once before in history — during the dot-com bubble.
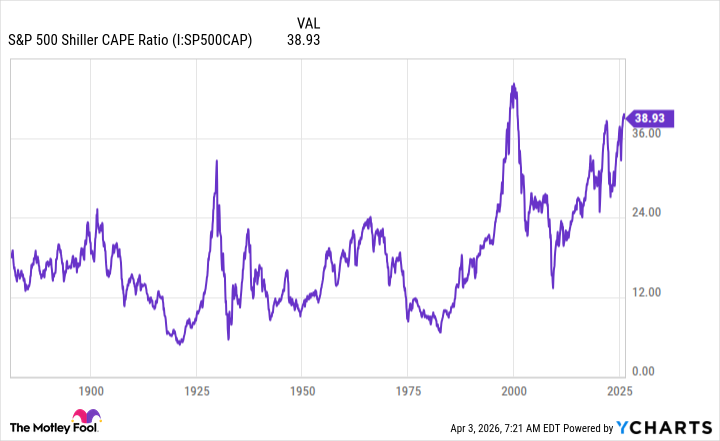
S&P 500 Shiller CAPE Ratio data by YCharts
Stocks are expensive, and even recent declines haven’t been enough to bring the overall price level back down to Earth. What happens when valuations are at peak levels? History shows that the market has declined on those occasions.
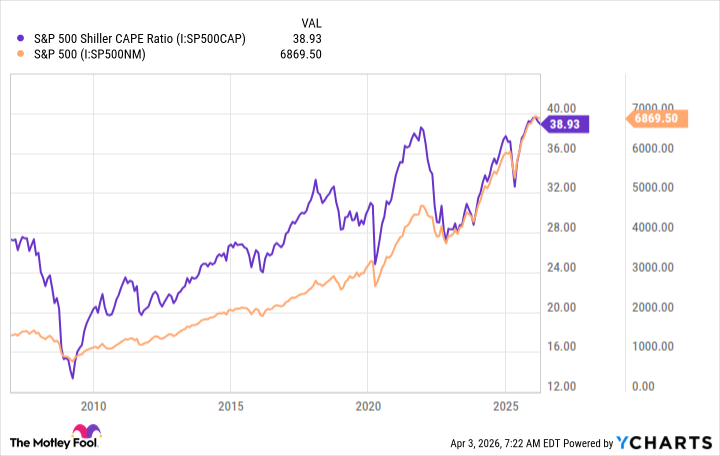
S&P 500 Shiller CAPE Ratio data by YCharts
So, Walmart, with its outperformance in relation to the luxury index, is sounding a warning bell for investors. And history paints a clear picture of what could happen next: Whether the economy slows significantly or slips into recession territory, the stock market, at today’s high valuation level, may be heading for further declines.
There are two silver linings in this dark cloud, however: First, a drop in stocks should bring valuations down, and lower valuations offer investors buying opportunities. So you may find high-quality stocks trading at excellent levels. And second, history also shows us that the market has always recovered after tough periods and gone on to reach new highs over time. This means that, by holding on to your quality stocks over the long term, you can weather any market storm.
Read Next

•By Sean Williams

•By Trevor Jennewine

•By Marc Guberti
Tariff Uncertainty Is Back: Why Selling Into the Fear Has Rarely Paid Off

•By David Dierking
Will the S&P 500 Crash in 2026? History Offers a Clear Answer

•By David Dierking
Why Some Investors Are Moving to Cash in 2026: Is That a Mistake?

•By Sean Williams
Is the Trump Bull Market in Its Final Act? History Offers a Decisive Answer.
About the Author

Adria Cimino is a contributing Motley Fool stock market analyst covering healthcare, technology, and consumer goods sectors. Prior to The Motley Fool, Adria covered the European stock market and U.S. stocks pre-market trading for Bloomberg News, Bloomberg TV, and Bloomberg Radio for more than a decade. Earlier in her career, she wrote about biotech, medtech, and technology companies in Boston for Mass High Tech, an American City Business Journals publication. She holds a bachelor’s degree in mass communications from the University of South Florida.
Stocks Mentioned

S&P 500 Index
SNPINDEX: ^GSPC
$6,582.69
(+0.11%)+$7.37

Walmart
NASDAQ: WMT
$125.79
(+0.84%)+$1.05

Goldman Sachs Group
NYSE: GS
$863.04
(+0.33%)+$2.83
*Average returns of all recommendations since inception. Cost basis and return based on previous market day close.
Sumber Artikel:
Fool.com
